You Can't Improve What You Can't See.
Many business owners make decisions based on gut feeling because they don't have access to meaningful business insights. That ends today.
Real-time
Business performance visibility
20h
Weekly reporting time saved on average
18%
Average margin improvement after 6 months
1 screen
Your entire business at a glance
The Challenge
Running on gut feel is costing you real money.
When your data lives across multiple disconnected systems — POS, payroll, inventory, accounting — you have to manually compile reports to understand how your business is actually performing. That takes hours every week and produces insights that are already outdated.
Without real-time visibility, problems compound. A rising labour cost percentage goes unnoticed for weeks. A location underperforming doesn't get addressed until the end of the quarter. A profitable product gets discontinued because no one ran the numbers.
The right reporting infrastructure gives you the clarity to act fast — on the right things — every single day.
Recommended Solutions
How Surpass gives you complete business visibility.
Executive Dashboards
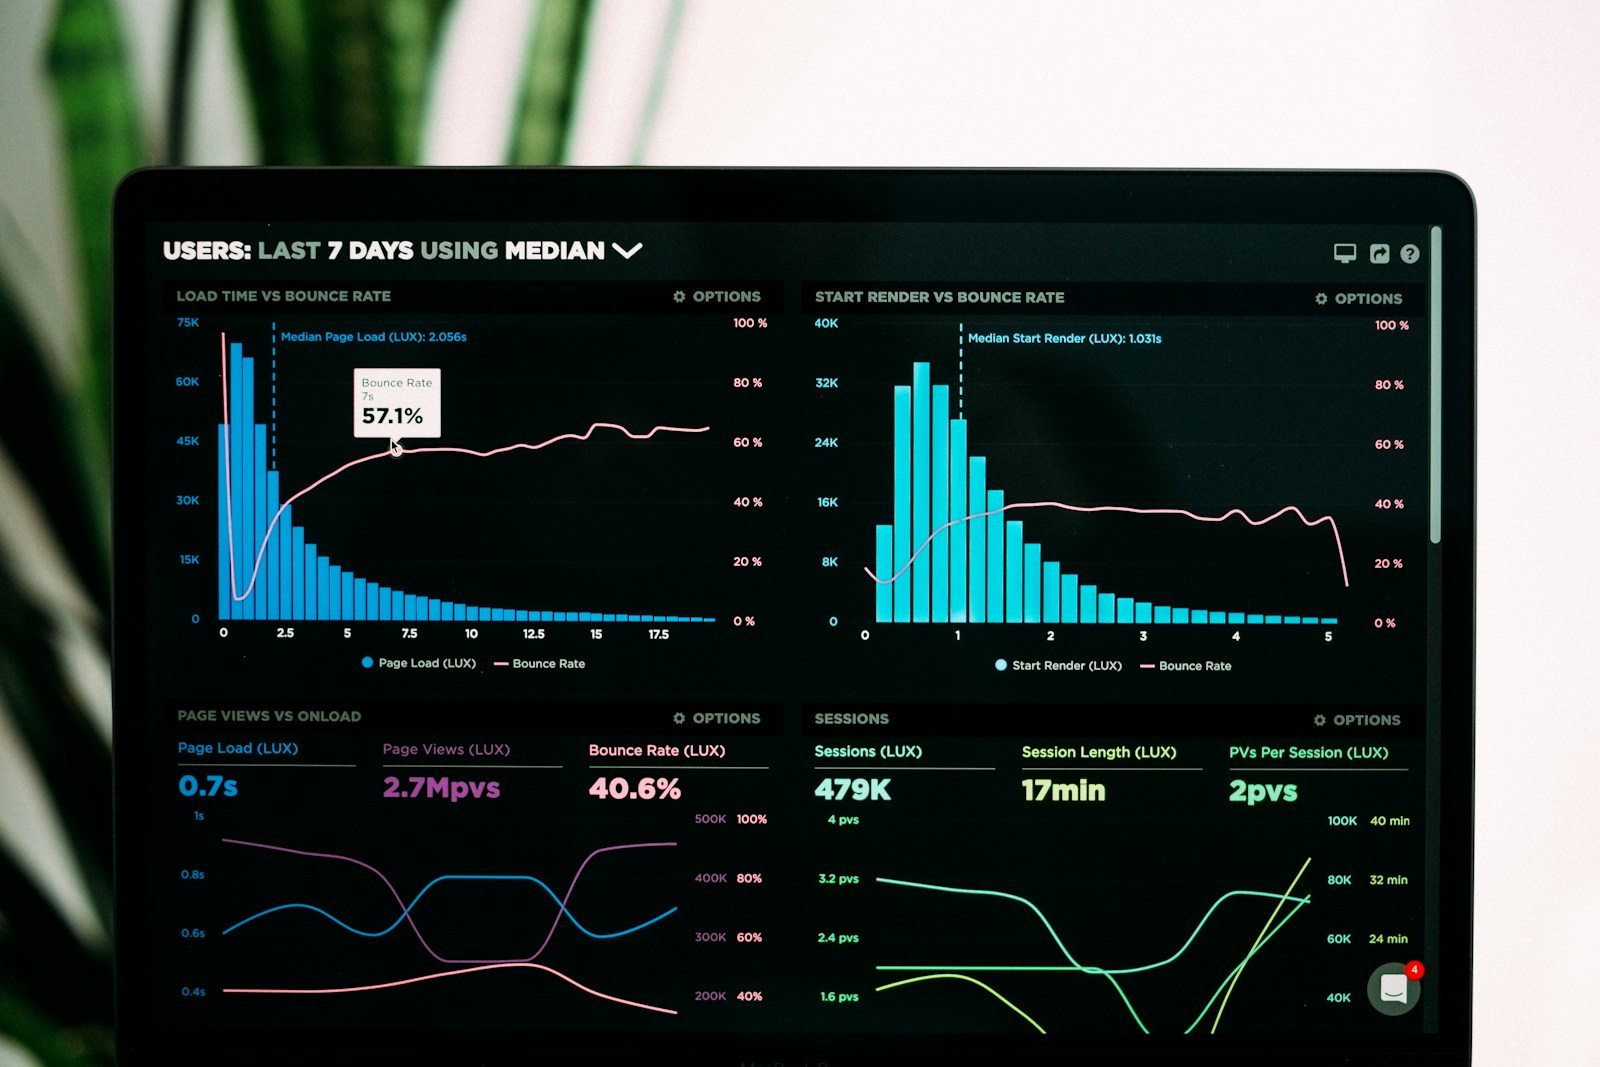
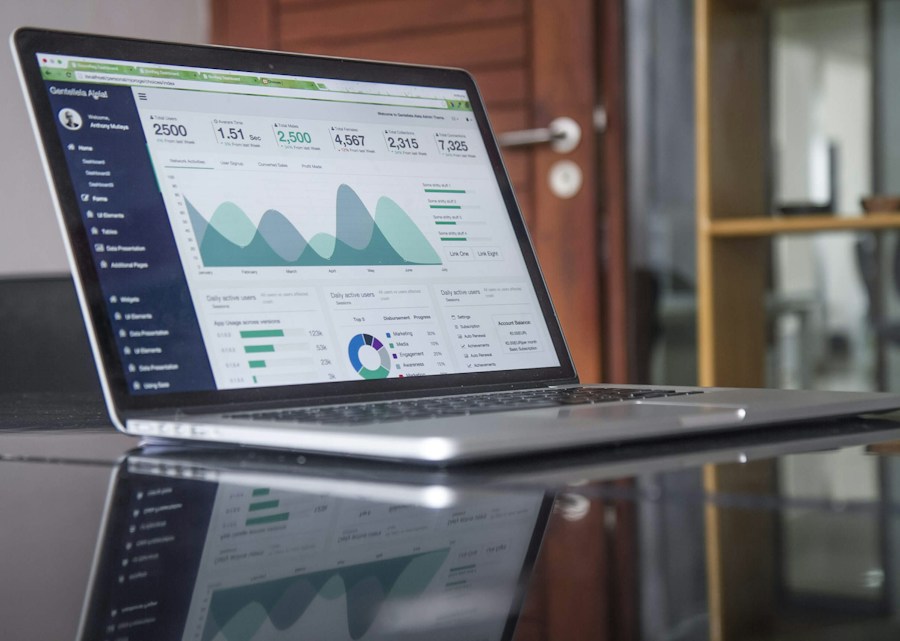
Your entire business performance on one screen — revenue, labour, margins, and trends — updated in real time so you never have to wait for end-of-week reports.
Reporting & Analytics
Scheduled daily, weekly, and monthly reports delivered automatically. Drill down into any metric, any location, any time period — with one click.
ABI Business Intelligence
AI that analyses your data and surfaces the insights you need to act on — before problems become expensive and before opportunities pass.
AI Business Insights
ABI doesn't just show you data — it tells you what it means. Anomaly detection, trend alerts, and performance recommendations delivered proactively.
Multi-Location Reporting
Compare every location side by side. Benchmark performance, identify your strongest and weakest sites, and allocate resources where they'll have the most impact.
Custom KPI Dashboards
Not every business measures the same things. We build custom dashboards around the KPIs that matter most to your business — and connect them to all your data sources.
FAQ
Frequently Asked Questions
Not sure which solution is right for your business?
Book a FREE Business Technology Assessment and let our team design the right solution for you.